SmartGraphs
Importance
Graph interpretation is a central skill in all fields of science, mathematics, and technology. For members of the public, understanding significant scientific and societal concepts — such as global warming, the stock market, or housing price fluctuations — often depends on making sense of graphs. Nonetheless, students of all ages demonstrate difficulties interpreting graphs. Students need to repeatedly explore, create, manipulate, and explain graphs in order to learn how to use them well. It’s the same process as learning the three R’s, and equally fundamental.
The SmartGraphs project was designed to help. It was funded by the National Science Foundation to follow up on seminal work in making science activities accessible to all learners through our Universal Design for Learning (UDL) Science project. We developed free, open-source software designed to help secondary math and science students become comfortable with graph interpretation.
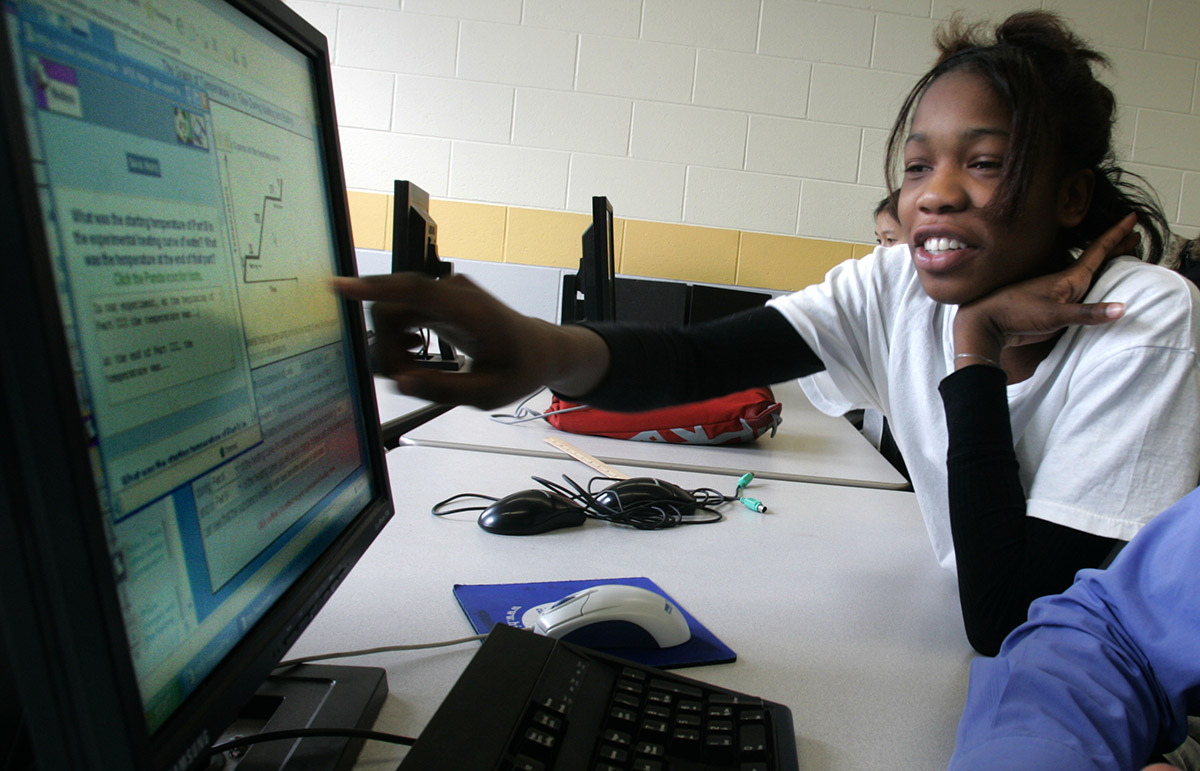
SmartGraphs help students to learn about graphs and the concepts represented in graphs by interacting with them. Hints and scaffolds — such as visually highlighting portions of graphs, stepping students through calculations of slope, reminding students about units of measurement, helping them understand and use scales, and pointing out links between representations (such as a table and a graph) — are used only when needed.
Research
SmartGraphs conducted a randomized experimental trial in 29 Pennsylvania schools. In 14 schools, 17 experimental teachers used SmartGraphs activities with 49 8th and 9th grade physical science classes studying the motion of objects (such as position-time and velocity-time graphs). In the other 15 schools, 18 control teachers taught the same topic using the same textbooks, with 42 physical science classes. This study sought to answer two research questions:
- What do teachers using SmartGraphs physical science activities believe about the software, including how well the software matches important learning goals for the motion unit of study? Based on the 203 sessions when experimental teachers used a SmartGraphs activity with a class, teachers agreed or strongly agreed that the SmartGraphs activities address important learning goals and help students meet those goals. Also, in 99% of the sessions teachers reported they would use the activity again, either exactly as is (63%) or with only minor changes (36%).
- Do students who use SmartGraphs activities learn more than comparison students studying the same topic from the same textbooks, but who do not use SmartGraphs activities? To answer this question, nearly 1,700 students completed a pre- and a post-test that included multiple-choice and constructed-response items assessing students’ understanding of about a dozen learning goals. The experimental students showed greater gains than the control students on all three measures: multiple-choice items, constructed-response items, and total score (see table below). In each case, the results are statistically significant.
Publications
MacKenzie, J. U., Zucker, A., & Staudt, C. (2015). Understanding algebra graphs Using SmartGraphs. Mathematics Teacher, 109(5), 387-390.
Zucker, A., Kay, R., & Staudt, C. (2014). Helping students make sense of graphs: An experimental trial of SmartGraphs software. Journal of Science Education and Technology, 23(3), 441-457.
Zucker, A., & Kay, R. (2012). Free SmartGraphs activities help students make sense of graphs. @Concord, 16(2), 4-6.
Zucker, A., & Staudt, C. (2011). SmartGraphs software helps students learn using graphs. @Concord, 15(1), 10-11.
Activities
View, launch, and assign activities developed by this project at the STEM Resource Finder.


