Data Stories and Interdisciplinary Project-Based Learning
When eighth grade teacher Rae Kennedy prepared for a curriculum module that centers around the book Farewell to Manzanar, she knew she needed to make it personal for her students. The book is a memoir by Jeanne Wakatsuki Houston about her experience in a Japanese American internment camp during World War II. Rae’s students had already explored storytelling and writing informative and argumentative essays. So when she introduced CODAP to her class—something her students may have expected in a math class, but not humanities—she assured them that using data to craft stories is another genre of authentic storytelling.
The DataPBL project enlisted a team of teachers, data science educators, and researchers to co-design data experiences for the eighth grade Japanese American Internment curriculum module developed by EL Education. In the DataPBL version of the interdisciplinary project-based module, students analyze and visualize data in CODAP. Project research is studying how students tell stories with data and how this data storytelling contributes to students’ data agency and identity.
Rae focused on the stories of Japanese American internees before, during, and after incarceration. To humanize data, she organized gallery walks and held discussions to elicit examples of data in students’ daily lives. She also introduced reasons why working with a dataset was important and helped students make connections with their prior experiences writing stories and essays.
Students were then tasked with creating an informative story using their insights from CODAP as well their opinions. They explored several datasets, including one with information from the WRA (War Relocation Authority) and the FAR (Final Accountability Records) about the people incarcerated at the Manzanar internment camp during World War II. Rae stressed that it was very important that her students “see the people that were incarcerated as human beings” and that they ascribe “meaningfulness in the stories [and] data.” In other words, students should be aware that the dots in CODAP, which represent a point on a graph or a row in a data table, are real people.
Narration with data
Telling stories that are meant to be empirically true requires sometimes contradictory discursive modes: narrative and logico-scientific. Narrative discourse involves creating a coherent storyline by including certain events and excluding others. Logico-scientific discourse involves making claims based on argumentative norms from the disciplines involved (e.g., science, history) and appeals to data. In interdisciplinary accounts, both narrative and logico-scientific discourses may contribute to a story’s action.Telling a story with data requires using both of these discursive modes.The CODAP Story Builder plugin supports students in making choices about which data to highlight.
Rae’s students used Story Builder to create data stories. Story Builder allows students to create a presentation of their data explorations, with each interactive slide capturing the state of the CODAP document at a given time, plus text annotations, images, and more. The DataPBL research team employed Joshua Radinsky’s idea* that narration with and around data can take four modes: (1) telling a story about oneself working with data, (2) animating a data representation, (3) incorporating data into extant narratives, and (4) narrating oneself into a data-represented world. The four modes were then mapped onto the stories narrated by the students to better understand how they transformed the data into stories.
Using Story Builder to tell a story
One student’s inquiry and data story exemplified the incorporation of all four of Radinsky’s modes of data narratives. Taylor (a pseudonym) prepared five slides in Story Builder that included graphs and text about her guiding questions, data examination and analysis processes, results, and interpretation.
Slide 1. Taylor’s guiding question was “How did being at incarceration camps for different periods of time affect how many people died?” Her first slide began with mode 3, incorporating data on how many people died into an extant narrative she had read about in Farewell to Manzanar and learned about in class sessions on the history of the Japanese American internment. Next, she used mode 1—narrating her own investigation—when she explicitly explained the origin of her idea:“I chose this topic because in class we read about people dying at incarceration camps, and I wondered how old the people were [when they] died.”
Slide 2. Taylor continued in mode 1, describing how and why she selected particular attributes from datasets to test her prediction about children born in incarceration camps.
Slide 3. Taylor remained in mode 1, describing her steps in making a graph. She then switched to mode 2—animating a data representation—saying,“The graph is about what year they were born.” She made an inference about the data collection:“I didn’t expect this outcome [that the data doesn’t include babies].What I think happened is when they collected this data they weren’t able to collect data from babies at this time.”
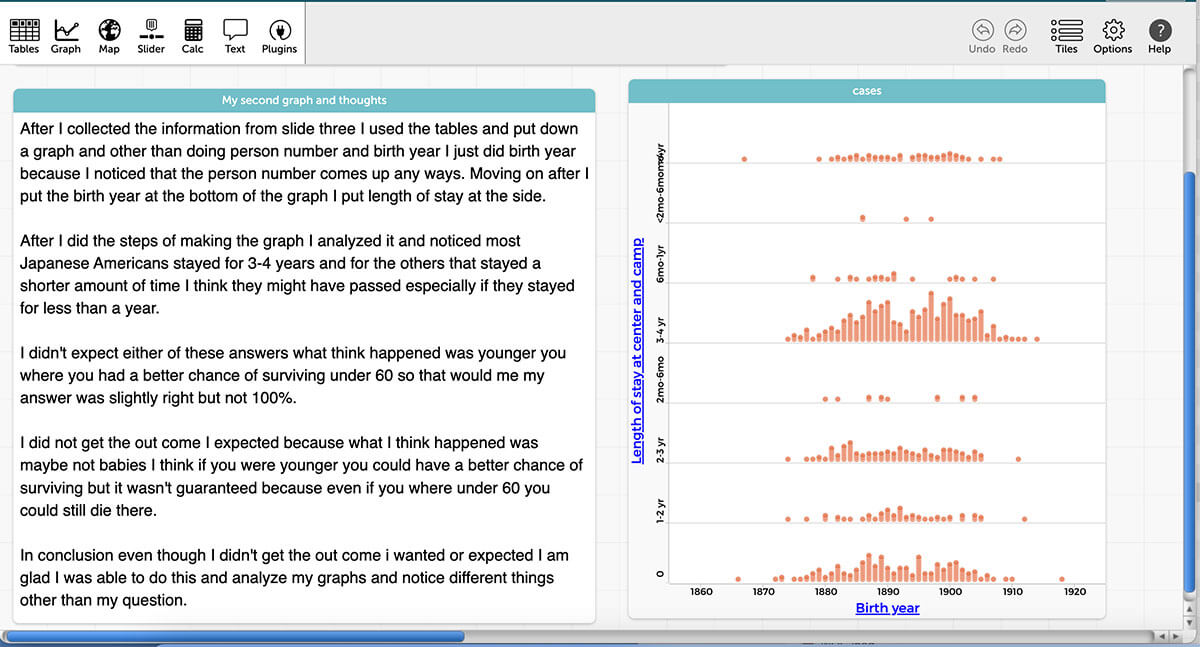
Slide 4. She continued with mode 2 by animating her data representations, noting,“After I did the steps of making the graph I analyzed it and noticed most Japanese Americans stayed for 3-4 years and others stayed a shorter amount of time.” To make sense of differences in the length of stay among the internees, Taylor connected “length of stay” and age, inferring “I think they might have passed, especially if they stayed for less than a year.”

Slide 5. In the final slide, Taylor switched to mode 4 by narrating herself into a data-represented world and reflecting on her takeaways working with the data: “Even though I didn’t get the outcome I wanted or expected, I am glad I was able to do this and analyze my graphs and notice different things other than my question.” Finally, she returned to mode 3, connecting to the extant narrative of “what we learned in class about forced Japanese American incarceration.” She said that her story “shows how old they were along with how long they were [in the camp] … I think the littler they stay in incarceration was the more likely they passed. Being in incarceration could and did kill innocent people.”
Taylor’s story incorporates both narrative and logico-scientific discourses by both choosing which attributes within the dataset to analyze and then using that data to support her story. She related to the experiences of marginalization based on identity and, by connecting her own identity and experiences in the contemporary United States to those of Japanese Americans, including Jeanne Wakatsuki Houston, she achieved mode 4 of data storytelling.
Conclusion
Data storytelling provides a means for students to connect to extant narratives, build their own stories of inquiring into meaningful questions with data, and ideally narrate themselves into data-represented worlds. Such skills can serve them well as they navigate our increasingly data-saturated world. In addition, opportunities to respond to their own questions through storytelling activities with well-curated data, teacher guidance, and collaborative work with peers enables students to connect emerging data agency and data identities with their existing intersectional identities. Taylor did so by engaging her identity and commitment to issues of justice. She manifested agency in calling for audience actions to “make sure this will not happen again.”
* Radinsky, J. (2020). Mobilities of data narratives. Cognition and Instruction, 38(3), 374–406.
Joe Polman (Joseph.Polman@colorado.edu) is a professor and associate dean for research at the University of Colorado Boulder.
Trang Tran (Trang.Tran@colorado.edu) is a doctoral student at the University of Colorado Boulder.
Kate Miller (kmiller@concord.org) is a research associate.
This material is based upon work supported by the George Lucas Educational Foundation and the National Science Foundation under Grant No. DRL-2200887. Any opinions, findings, and conclusions or recommendations expressed in this material are those of the author(s) and do not necessarily reflect the views of the funders.