
Critical Tools for Solving Today’s Complex Problems
A Framework for K-12 Science Education and the Next Generation Science Standards (NGSS) include Systems and System Models as one of the seven crosscutting concepts and Developing and Using Models as one of the eight science and engineering practices, highlighting their importance across disciplines. However, it is rare for people outside of professional circles to apply systems thinking and system modeling to explain or develop an understanding of phenomena. Indeed, even professionals sometimes fail to take a systems perspective. Consider, for example, a well-meaning intervention gone wrong that was intended to stem a malaria outbreak.
A failure to think systemically
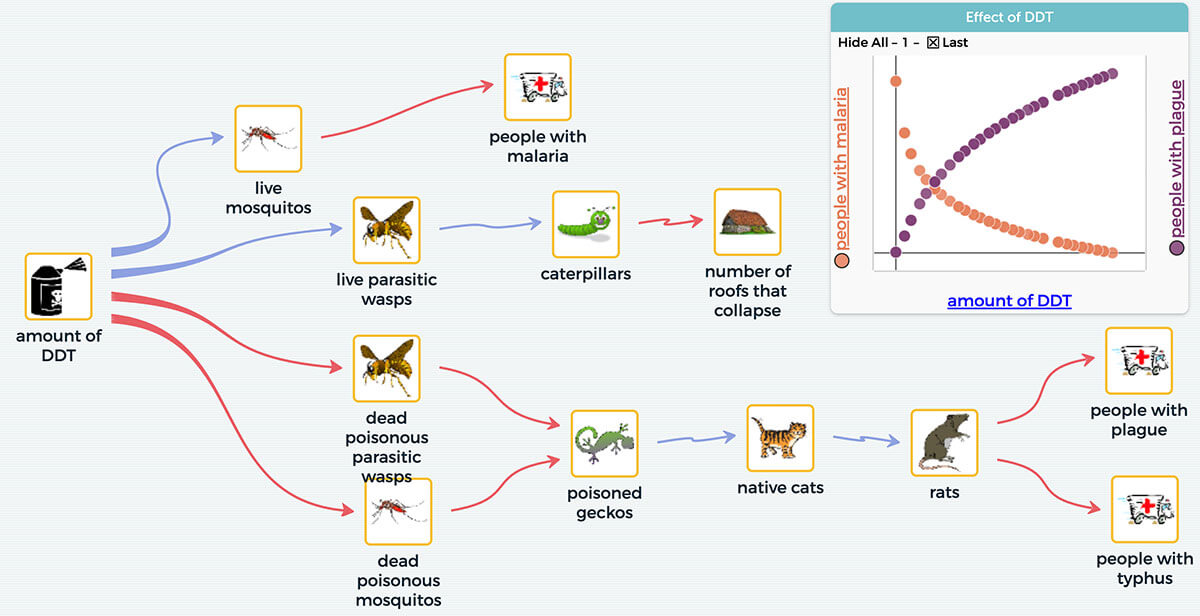
About 70 years ago the Dayak people on the island of Borneo experienced a severe outbreak of malaria.The World Health Organization (WHO) sprayed large amounts of pesticide to kill the mosquitos that carried malaria and infected people. In the short term the pesticide worked well, killing many mosquitos and reducing the incidence of malaria. However, there were unexpected side effects, which started with the collapse of many thatch roofs, a common roofing material for the Dayak homes.The pesticide killed not only the mosquitos, it also wiped out the population of parasitic wasps that preyed upon a caterpillar that eats thatch.Without the wasps, the caterpillar population grew exponentially, damaging the roofs of many dwellings. Furthermore, the ground was littered with dead insects that were poisonous because of the pesticide they had ingested. Geckos ate the poisoned insects, then cats ate the geckos and died.Without cats to keep the rat population in check, the number of rats exploded and spread diseases such as plague and typhus. Ultimately, the WHO parachuted in 14,000 cats in crates to address the outbreak of these two new diseases.
This situation serves as a stark warning and exemplifies the need for both a systems lens when addressing the interconnected world we live in and a set of diverse perspectives to design solutions to local problems. Because the human mind cannot compute and predict all relevant interactions in a complex system, computational systems modeling is a critical tool for solving some of our most pressing problems. Using SageModeler, a systems modeling tool developed with students in mind, we can model the situation in Borneo (Figure 1).
SageModeler has been used in elementary to undergraduate classrooms. Depending on the students and the type of phenomenon or system being modeled, any of the following modeling approaches might be the most appropriate.
Diagramming the system
SageModeler can be used as a diagramming tool, similar to other concept or mind mapping tools. This approach is most commonly used at the elementary level, but depending on your goal it could be used in many other situations. Students add nodes to the canvas, which can represent components of the system, either objects or variables.They connect these components with arrows and can add text descriptions. If all of the nodes represent measurable variables, they can also color the arrows that link the components to indicate how a change in one component would affect the other. However, there is no way to simulate the resulting diagram, which simply represents an illustration of the system.
Understanding basic relationships
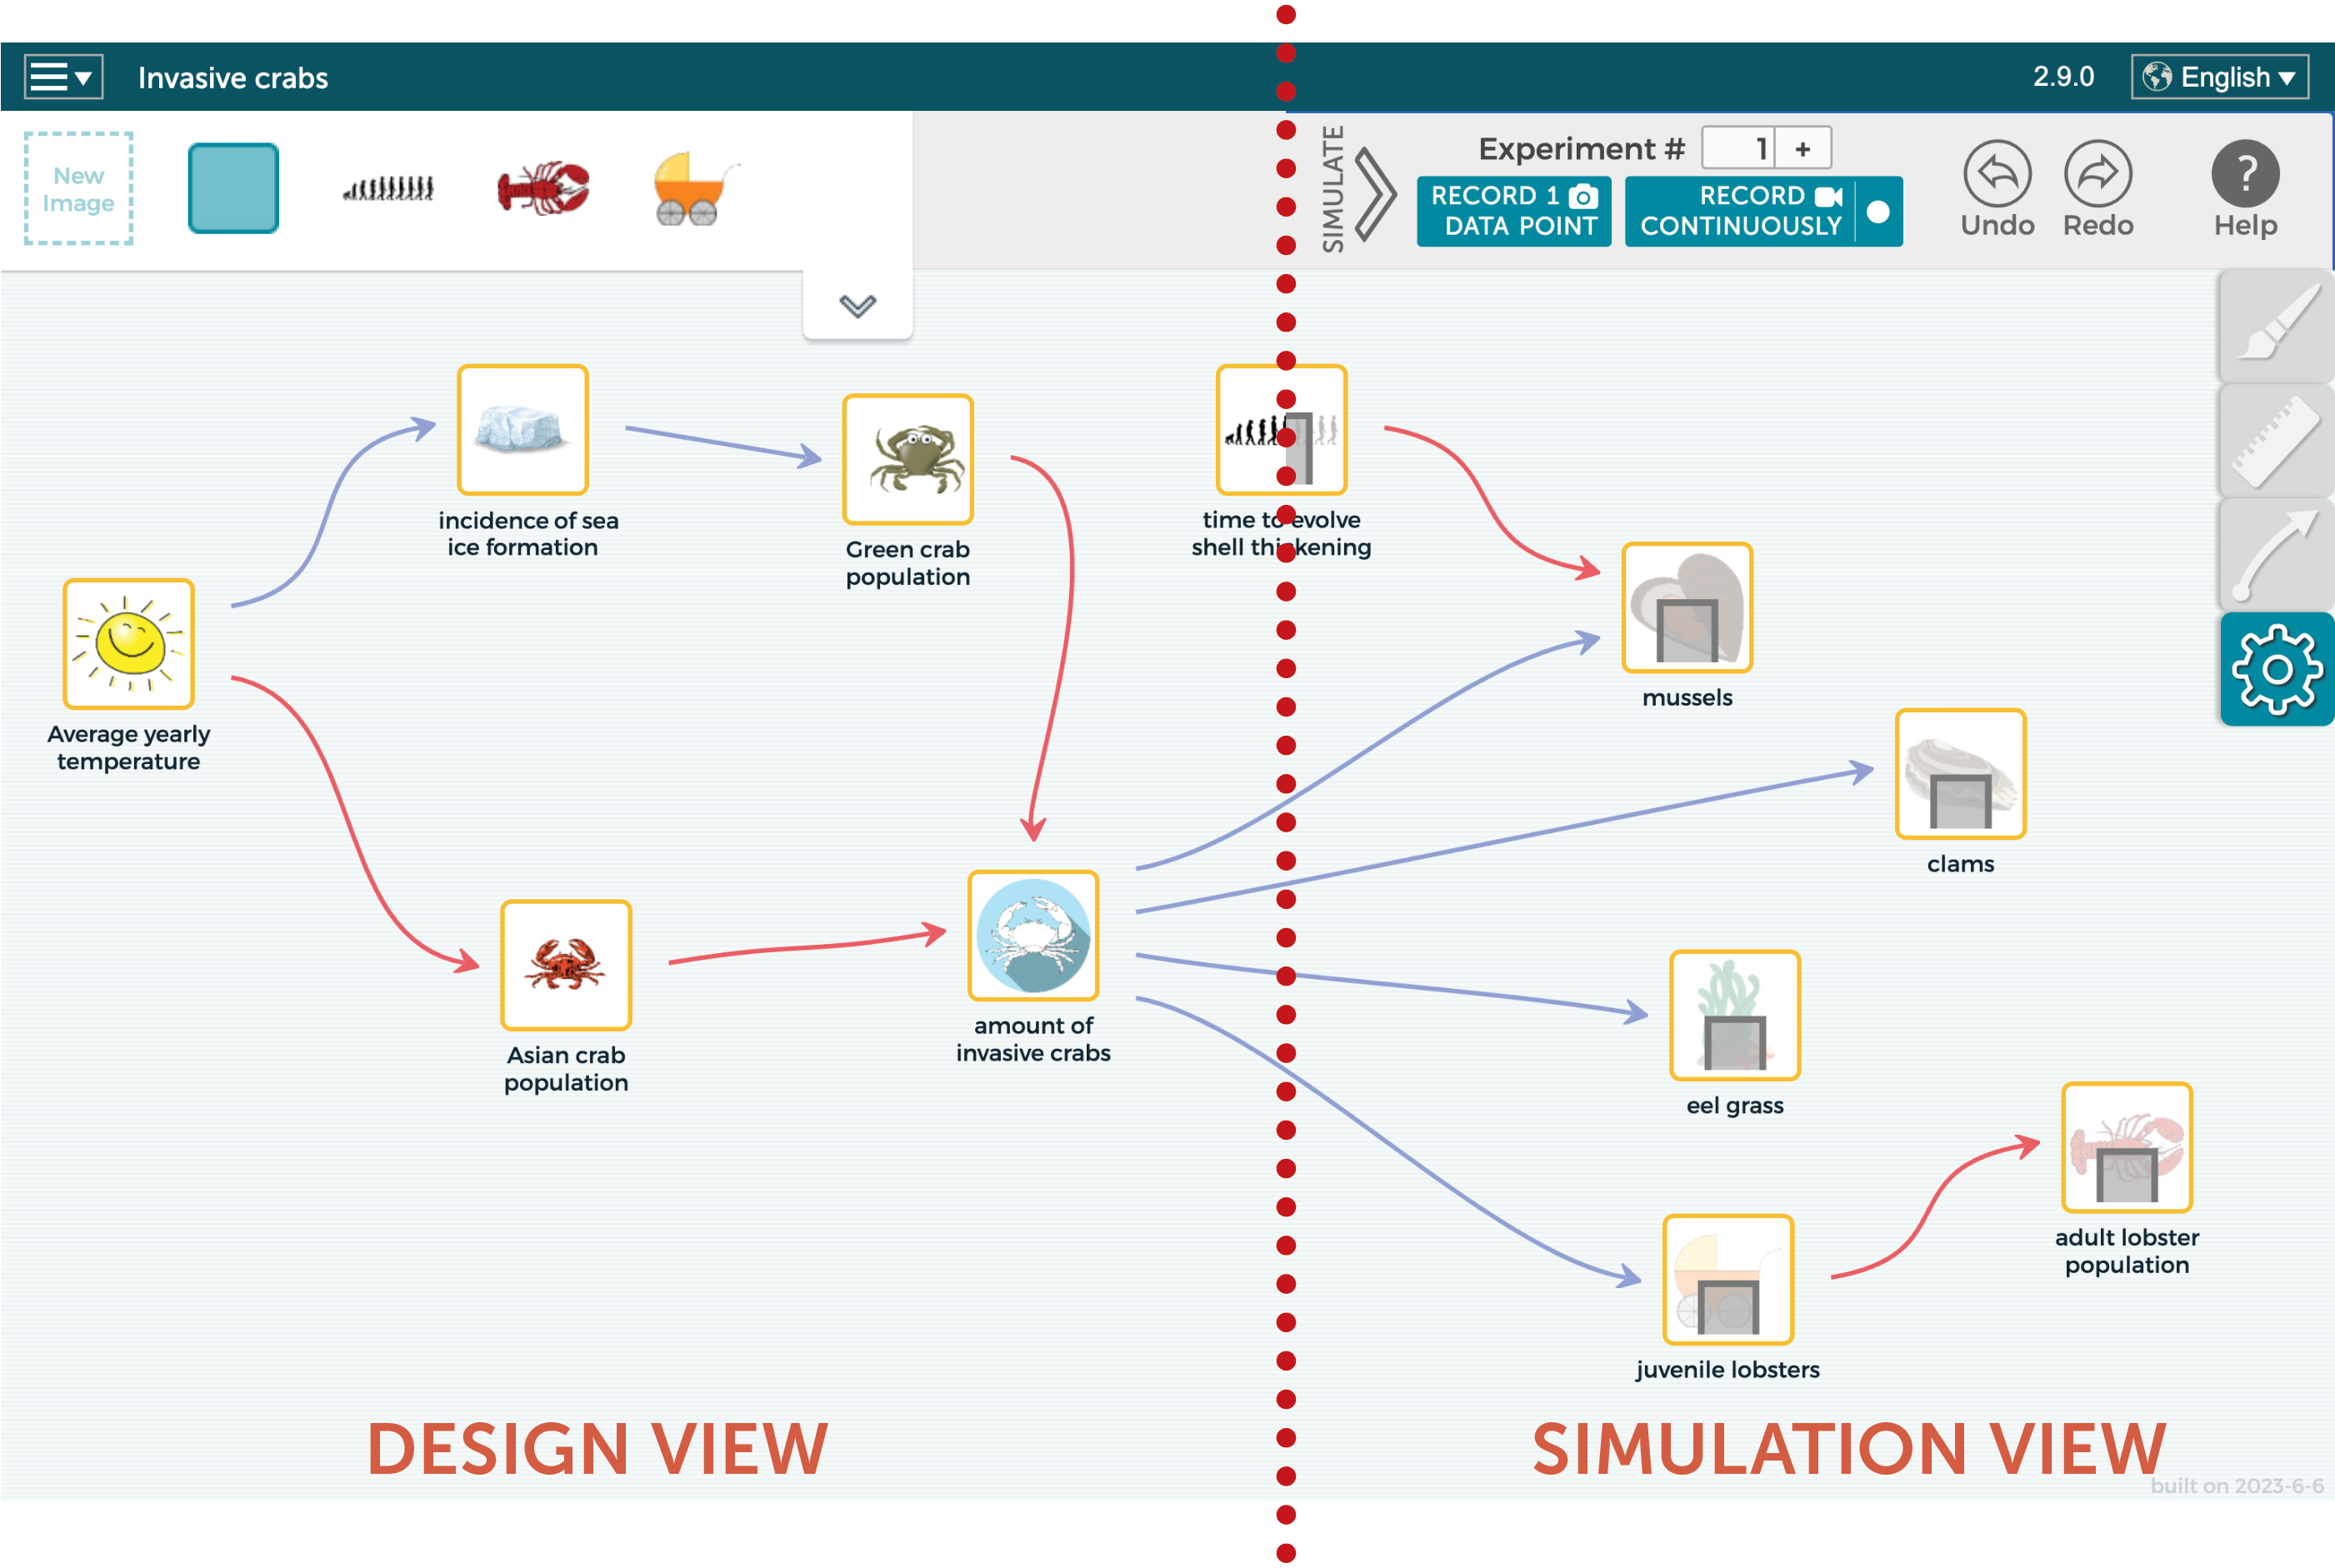
Static equilibrium modeling is appropriate when the goal is to understand basic relationships between components in a system (Figure 2). It is based on chains of cause and effect where a change in any independent variable instantaneously ripples through the system, causing all other linked variables to change their value accordingly. Students use nodes and arrows as in a system diagram, but each system component must represent a quantifiable variable and the links must specify the direction of cause and effect, so that the whole model can be simulated. Each arrow represents a relationship between variables that can be defined semi-quantitatively, using written descriptions and pictures of graphs depicting the relationship. By simulating the model, students can test their ideas about how the system will function as they change independent variables and see how those changes affect the state of the system. Bar graphs represent a single value based on the current model input settings.
Exploring how systems evolve
Dynamic time-based modeling is a form of system dynamics modeling used when the goal is to explore how a system evolves over time and when there is feedback in the system. Global warming, the shape of a pandemic infection curve, and a biochemical reaction pathway are all examples of systems that evolve over time. A classic example of such a system is a predator-prey ecosystem as shown in Figure 3. Notice that the graphs inside each variable are now line graphs, which show how the value of the variable changes over time. Students can import real-world data into SageModeler for comparison to the model output, and explore ways to modify their model as they compare its behavior to what happens in the real world.
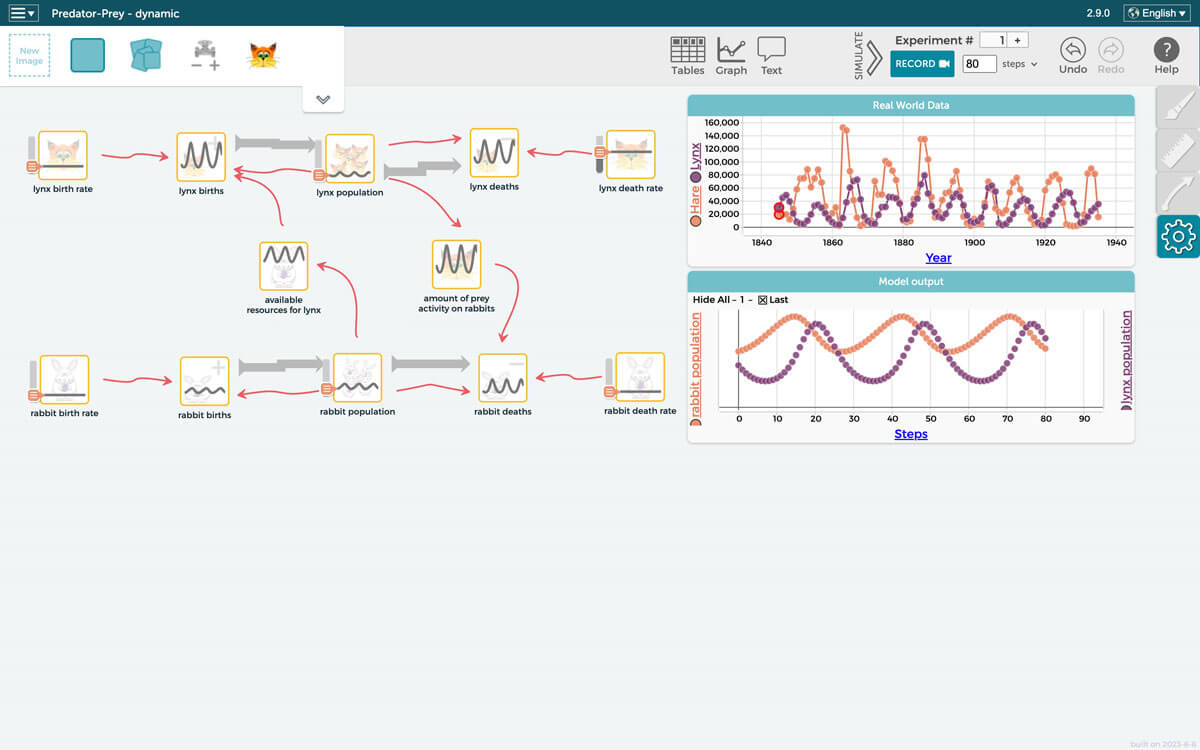
of lynx and rabbit change over time. Feedback in the system causes a periodic pattern with both populations rising and falling as first one species dominates and then the other. The top graph represents real-world data and the bottom graph depicts model simulation output.
A pedagogical approach to systems thinking
The Multilevel Computational Modeling project, a collaboration between the Concord Consortium and the CREATE for STEM Institute at Michigan State University, developed SageModeler and worked with teachers to design a pedagogical model for infusing curriculum units with a systems modeling approach. We started from a project-based learning framework, which includes engaging students in relevant and meaningful learning experiences designed to make sense of a phenomenon or solve a real-world problem.
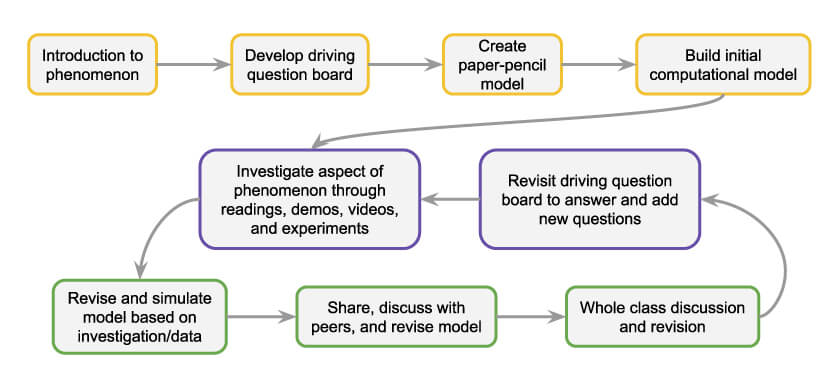
The units provide opportunities for students to engage in the NGSS science and engineering practice of Developing and Using Models and the crosscutting concept of Systems and System Models, plus content-specific disciplinary core ideas related to the phenomenon or system being modeled. Figure 4 shows how students engage in iterative cycles of model revision, including studying an aspect of the phenomenon, revising the model based on new information, discussing the model with peers, and revising again. This loop happens several times throughout the unit as students both expand and hone their model on their way to becoming true system thinkers.
Dan Damelin (ddamelin@concord.org) is a senior scientist.
This material is based upon work supported by the National Science Foundation under Grant No. DRL-1842035. Any opinions, findings, and conclusions or recommendations expressed in this material are those of the author(s) and do not necessarily reflect the views of the National Science Foundation.